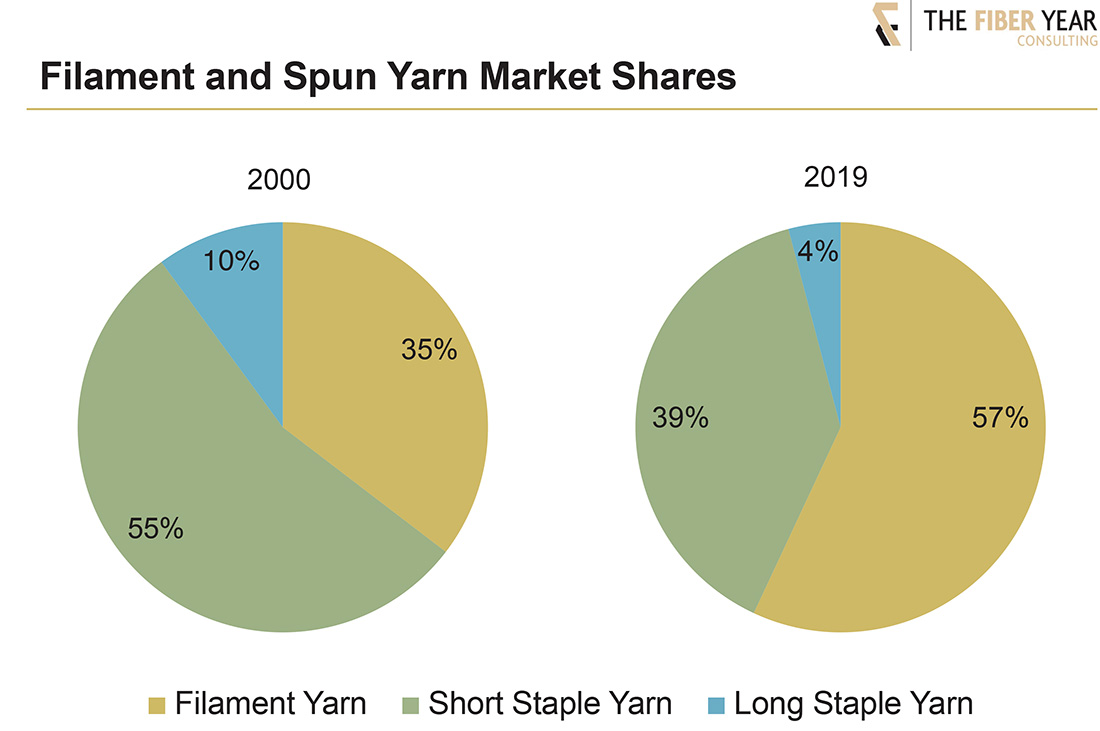
Both filament and spun yarn production marked new all-time highs achieving a joint level of 96 million tonnes in 2019. The average annual growth rate of yarn production in the century accounted for 4%, driven by faster filament expansion of 6% annually while spun yarns advanced 2%. Rapid filament growth led to parity in 2013, and the current share amounted to 57% and is expected to further grow in the years to come despite a potential setback in 2020.
Rapid changes in the global yarn business become obvious with filaments expanding their share from 35% at the beginning of the century to 57% in 2019. That is equal to the addition of 38 million tonnes during that period, while spun yarns just managed to increase their supply by 11 million tonnes. The majority of growth is closely linked with the Chinese industry where more than three quarters of filaments originate from.
World filament yarn output in 2019 was up 6% to 55 million tonnes, as polyester, with an overwhelming industry share of more than 80%, grew 7% to 46 million tonnes. Nylon marginally advanced 1% to 5 million tonnes, while polypropylene decreased by 3% to 2 million tonnes and viscose yarn types softened 3% to 0.3 million tonnes. Manmade cellulosic filaments hold a marginal share of 0.6% by now versus nearly 19% in 1980, but expansions in the future are expected.
Most of the leading industries succeeded to lift their spinning activities in the quota-free era, with China more than doubling its volume to enlarge its market share by 15 percentage points to 64% by now. Both Chinese and Indian manufacturing expansions, accounting for nearly 6% on average per year, clearly outperformed world demand growth.
The entire spun yarn business modestly rose less than 2% on yearly average in the century and suffered from the long-term decrease of long staple yarns, predominantly processing wool and acrylic fibers. Supply of both staple fiber types significantly contracted during the past two decades. Meanwhile, essential precursors for the short staple industry like cotton, polyester and viscose staple fibers all succeeded to lift their supply levels.
Dynamics summarized in the chart from 2000 reveal a tolerably parallel development and more accelerated growth of filaments for most of the time. Total yarn supply was negatively impacted by the financial crisis and will also be seriously affected by the pandemic.
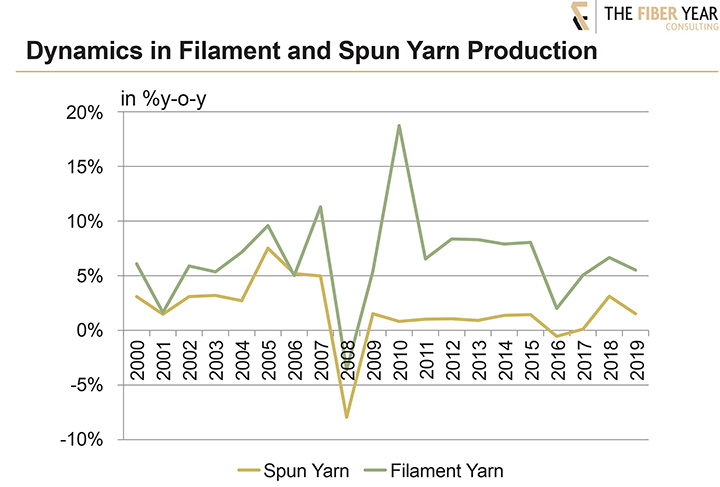
Evidence suggests for the previous year, described in detail in The Fiber Year 2021, that filament yarn manufacturing was hardest hit by the pandemic, while secondary spinning of essentially cotton yarns and cotton/polyester blends weathered the COVID-related contraction with fewer losses.
Most of the leading industries succeeded to lift their spinning activities in the quota-free era, with China more than doubling its volume to enlarge its market share by 15 percentage points to 64% by now. Both Chinese and Indian manufacturing expansions, accounting for nearly 6% on average per year, clearly outperformed world demand growth.
Faster momentum, admittedly from much lower levels, has been experienced in Vietnam (AAGR: 16%) and Bangladesh (8%). As both industries are fully depending on cotton imports to keep their processing and garmenting units running, the actual cotton price level in early March 2021, last seen in early August 2018, may exert pressure on future apparel exports.
The group of countries including Pakistan, Turkey and Indonesia managed to lift their spinning activities each at more than 2% annually on average. While the Indonesian cotton import dependence is similar to the aforementioned nations, Pakistan’s crop failure makes the industry an increasingly attractive fiber sales destination of polyester and viscose for cotton replacement. To tackle the shortcoming in cotton, projected to mark a 37-season low in 2020/21, the Prime Minister of Pakistan recently launched an emergency program to improve cotton production in the coming years through new seed varieties and incentives for the farmers to woo them for cotton cultivation.
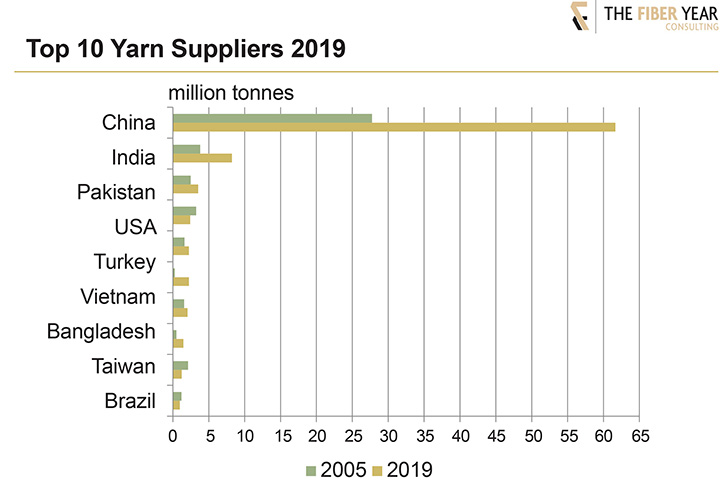
The remaining industries in the U.S., Taiwan and Brazil have all been facing multi-year declines. The performance in Brazil is especially worth mentioning, as domestic cotton output hit an all-time high in the 2019/20 season at 3 million tonnes, while local use continues to drop. Instead of lifting added value in the domestic industry, the vast majority of raw cotton is being destined for exports. This strategy looks promising in the light of high cotton prices at present, but cotton fundamentals rather justify price cuts, with the 2020/21 season’s ending stocks at global stage projected at the fourth-largest level in history.
The next installment of “The Fiber Year” column will introduce key findings of The Fiber Year 2021 report, which is scheduled for release in May.