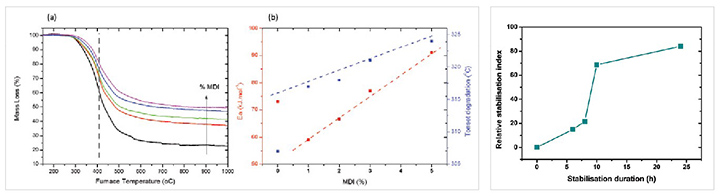
Figure 2. (a) Thermal degradation plots for OHL/TPU 50:50 blend stabilized on a fast rate with various amount of MDI added. (b) Variation of the temperature of onset of degradation and of the activation energy of degradation as a function of the composition in MDI for the stabilized materials, (c) Relative stabilization index for stabilized blends as a function of the stabilization temperature profile to 250 C.
IFJ_012022_studentspotlight_Figure2