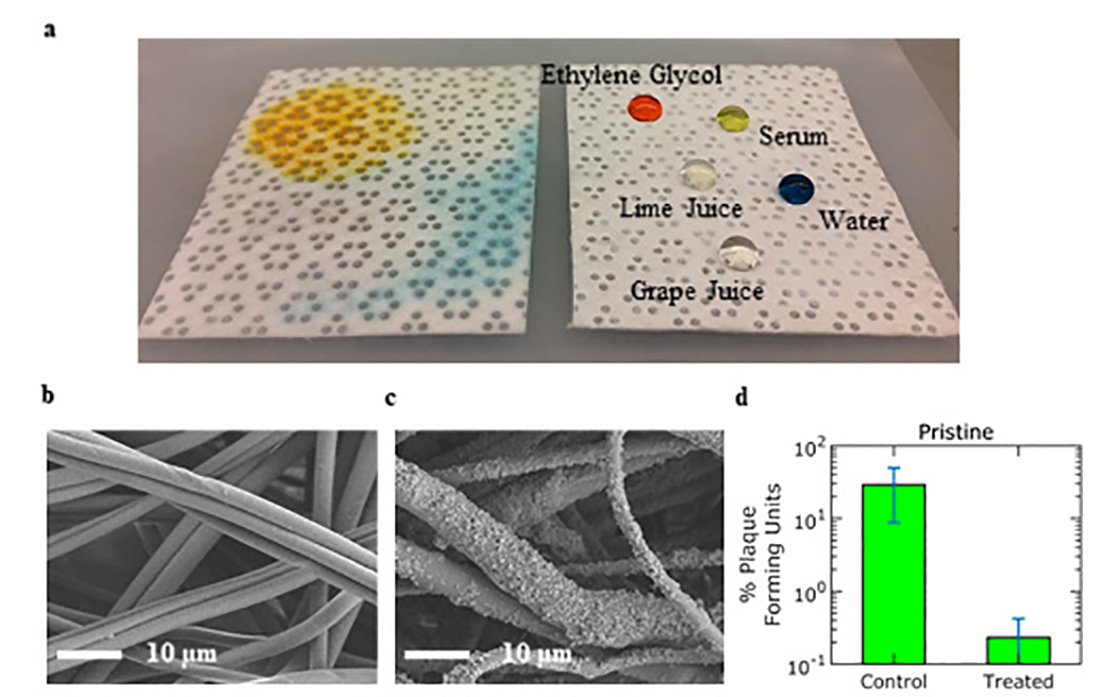
Figure 1. a) Control (left) and treated (right) polypropylene textiles with different types of liquid droplets b) SEM image of control textile c) SEM image of treated textile d) Percent plaque forming units of adenovirus type 4a on pristine control and treated textiles.
IFJ_04-2020_studentspotlight_Figure1