Filament growth rates have been faster for most of the almost four decades shown in the next chart than the world fiber market movement. Their long-term growth rate amounts to 5.6%, although the expansion in the most recent three years was at slowest pace in modern textile industry. The deceleration was related to economic uncertainty, destocking and slowing consumption at retail stage.

Filament supply has tremendously gained weight from 6 million tonnes in 1980 to 48 million tonnes at present. Dominant fiber type is polyester comprising textile, industrial and carpet applications with an industry share beyond 80%. Polyamide ranks second after lifting its volume recently, occupying around 10% of the segment, while polypropylene in the long run was quite flat. Spandex, offering exceptional elasticity to garment products without compromising on comfort, enjoyed strong dynamics with the manufacturing volume doubling in the previous seven years to account for nearly 1 million tonnes. Cellulosics hold a marginal share of less than 1% by now versus nearly 19% in 1980, but expansions in future are expected.
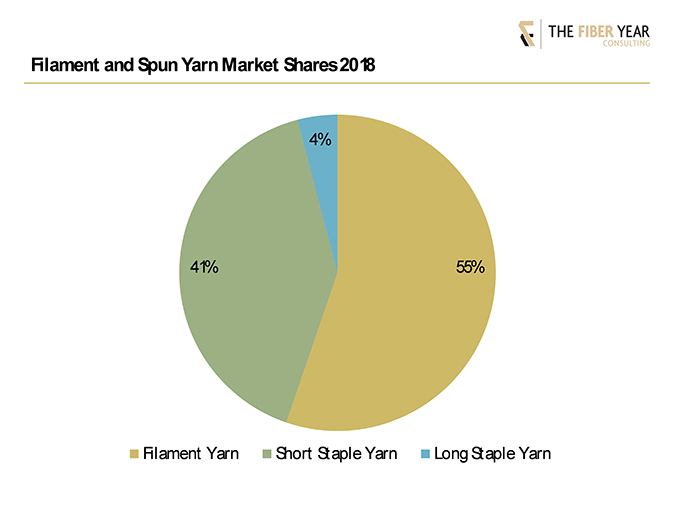
The manufacturing volume of spun yarns was virtually stable after 2012, accounting for around 39 million tonnes annually. Spun yarns used to hold the majority in volume terms until 2013, but they were not able to compete with stunning filament growth in more recent years. Advantages in price, enhanced properties, massive feedstock investments, security in fiber supply and eventually the artificial cotton price hike in 2010-11 have triggered a filament boom. However, growth of both types of yarns remained in the third consecutive year below 2%, hence, missing the average annual growth rate of 3.5% in the century. The current market forces are illustrated in the following chart.

Most of the leading industries succeeded in lifting spinning activities in the quota-free era, with China almost doubling its volume to enlarge its market share by 10 percentage points to 62% by now. Secondary spinning modestly expanded spun yarn output, despite almost 80 million spindles installed in that period according to the International Textile Manufacturers Federation (ITMF). Meanwhile, filament supply more than tripled to arrive at 35 million tonnes last year, almost equal to the entire world’s production in the year 2012.
India, with the world‘s second-largest cotton and manmade fiber industry, has experienced dynamics in both segments, even if the former dominance of cotton yarns disappeared, declining from a share of 64% in 2005 to a share of 50% at present. Their volume was virtually on a par with filaments at about 4 million tonnes in the most recent year.
Contrary, the small-scale filament business in Pakistan is negligible, and cotton processing drives the industry. Nearly 30% of cotton used by Pakistan’s filament business is sourced abroad to meet subsequent requirements, as domestic cotton cultivation has not yet recover from the disastrous harvest in the 2015-016 season. This contraction by a third marked Pakistan’s lowest cotton output in the century.
Global filament yarn output arrived at a new all-time high driven by dynamic growth of polyester filaments while spun yarn production in 2018 slightly decreased. The total volume of yarns supplied to the market in the previous year accounted for 87 million tonnes, up again at below-average pace over 2017 compared with the average yearly rate of increase in the century at 3.5%. Filaments enjoyed an average annual growth of 6.1% in the century, versus 1.4% in the spun yarn business.
The performance in the U.S. was characterized by a drop in both spun and filament yarns, whereas the filament sector recovered from financial crisis and managed to gently enlarge local production. Cotton yarn spinning moved sideways after the financial crisis, and its output was almost cut in half compared with 2005. This crop, however, is essential, as the country remains by far the largest exporter of cotton.
Outstanding dynamics have been observed in Vietnam, admittedly from a very low baseline. The country evolved into the third-largest cotton importer in the current season at around 1.6 million tonnes, and the build-up of manmade fiber capacities have made the industry the third-largest producer of polyester industrial yarns. The dynamic development was favored by the World Trade Organization accession in January 2007, as well as current circumstances such as rising labor costs in China and the U.S.-China trade war, which promoted further expansions. The growth momentum is expected to continue with duty-free agreements boosting exports in the future due to the Comprehensive and Progressive Agreement for Trans-Pacific Partnership (CPTPP) with 10 other Asia-Pacific countries and the free trade deal with the European Union.
The five nations highlighted in this article were responsible for 80% of the global yarn supply, up 10 percentage points over 2005. The growth drivers for the Asian countries will remain in place just as the gradual diminution of the U.S. textile chain. More fiber and yarn production profiles are available in the report for the Americas (Brazil, Mexico), Greater Europe (EU, Russia, Turkey) and Asia (Bangladesh, Indonesia, Japan, Korea, Malaysia, Myanmar, Taiwan, Thailand).

This article is based on material abstracted from the textile yearbook, The Fiber Year, which covers global trends in manmade and natural fiber production, including nonwovens and unspun materials. The Fiber Year provides trade data for main markets and contains several contributions from industry experts in the area of biopolymers, cotton, wool, viscose and synthetics, nonwovens as well as ITMF textile machinery shipments. A table of contents is available at www.thefiberyear.com.
In the next installment of “The Fiber Year” column, world staple fibers will be highlighted.


