Market Data & Pricing

How the US-China trade dispute is affecting cotton markets worldwide
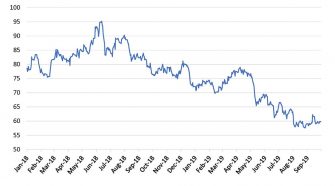
As has been the case in many financial markets, the global cotton supply chain has been distorted by the U.S.-China trade dispute. At the fiber level, the dispute has interfered …

Global development of spun and filament yarns
Filament growth rates have been faster for most of the almost four decades shown in the next chart than the world fiber market movement. Their long-term growth rate amounts to …

Worldwide staple fiber-based nonwoven consumption
Staple fiber represents nearly two-thirds (59%) of the resin and staple fiber used in the nonwovens industry. The consumption of staple fibers by drylaid, wetlaid, and airlaid short-fiber nonwovens production …

Market trends in fiber import-export countries worldwide
Most of the top-10 exporting countries lifted their shipments in value terms in 2018 (Figure 1). The recovery of Chinese exports continued with the total value increasing 4 percent to US $277 billion. However, value-added garment exports remain about 15 percent below their peak 2014 level, without any significant movement over the past three years. Knitwear and woven apparel exports remain among the top-10 Chinese export categories, albeit gradually losing weight as the Chinese economy continues to diversify.

Fiber industry faces economic headwinds
The world economy started off on an optimistic note in 2018, following growth in manufacturing and trade the previous year. But optimism gave way to a downturn from midyear, as the International Monetary Fund revised down its 2018 projections for most advanced economies and predicted significantly lower growth expectations for 2019.

